Introduction: Geology, floristic provinces, endemism, distributional patterns

 |
 |
 |
 |
 |
 |
 |
 |
 |
 |
 |
 |
 |
 |
 |
 |
 |
 |
 |
") |
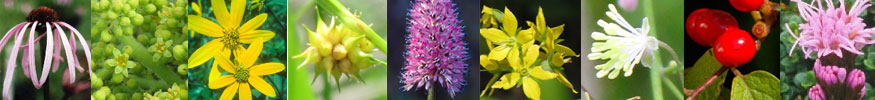
Rarity in age


Rarity in form
")

Species richness and endemism on a global scale

Fig. (Kier et al. 2009 [PNAS]). Global patterns of endemism richness (ER; range equivalents per 10,000 km2) for (A) vascular plants, (B) terrestrial vertebrates, (C) amphibians, (D) reptiles, (E) birds, and (F) mammals across 90 biogeographic regions.


Introduction to the flora of the southeastern United
Sates and the Carolinas
(incl. comparative floristics, patterns of endemism at regional and local scales, plant communities)
Plant species richness in the Southeastern United States
Atlantic & Gulf Coastal Plains [6000 spp; 1306 endemic spp. + 297 endemic subsp.; 21–26% endemism; fide Sorrie & Weakley 2001]
244 spp. new to science described in southeastern United States since 1960s (incl. 83 taxa occurring in the Carolinas)
Southern and Central Appalachians and Piedmont __________?
Interior Low Plateau and Ozark/Ouachita Highlands_________?
Tropical South Florida [1647 spp + 190 ssp; 165 spp (9%) in this area endemic to Florida fide Long & Lakela 1971;
Sorrie & Weakley 2001 estimate 53 spp endemic to South Florida]
Table: Species richness and endemism (from Gentry 1986 or Acevedo & Strong 2012 [West Indian Islands only], unless otherwise indicated)
|
Region |
Area (x103 km2) |
No. spp. |
No.endemic spp. |
% Endemic spp. |
|
Europe |
10,000 |
10,500 |
3500 |
33 |
|
United States*** |
9,826 |
17,000–23,455 (+~8000ssp) |
4036**** |
17–23 (?) |
|
British Isles |
308 |
1443 |
17 |
1 |
|
Puerto Rico |
8 |
2221 |
305 |
13.6 |
|
Galapagos |
7.9 |
701 |
175 |
25 |
|
Hawaii |
16 |
970 |
883 |
91 |
|
New Zealand |
268 |
1996 |
1618 |
81 |
|
New Caledonia |
17 |
3256 |
2474 |
76 |
|
Jamaica |
10 |
2540 |
874 |
34 |
|
Hispaniola |
77 |
4612 |
2032 |
43.9 |
|
Cuba |
114 |
5991 |
3187 |
53 |
|
California FP***** |
411 |
5500 |
2387 (taxa, not spp) |
43 |
|
Texas |
751 |
4196 |
379 |
9 |
|
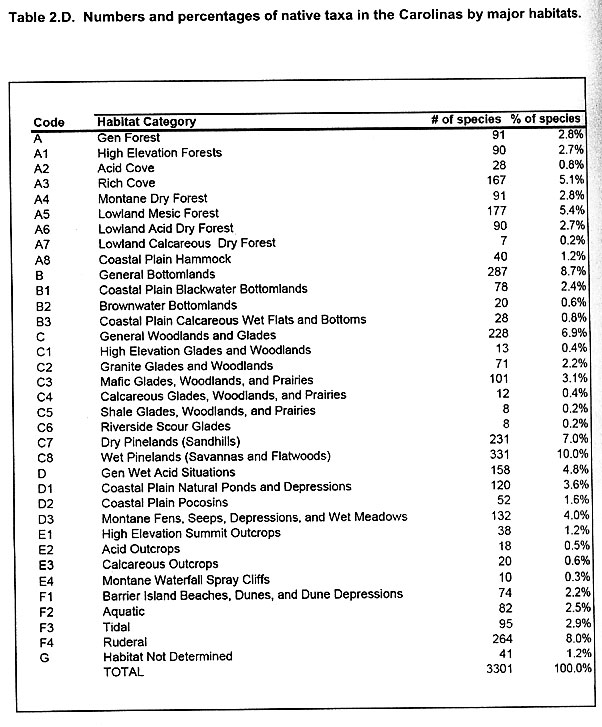
Carolinas* |
221 |
3301 |
58 taxa overall, of which 22 are strict endemics of the Carolina Coastal Plain |
1.8 |
|
Atlantic & Gulf Coastal Plain** |
1,166 |
6000 (native; 1950 additional exotics) |
1603 (incl. 1306 spp. and 297 subsp.) |
27 |
*Data from Weakley (2005) and LeBlond (2001)
** Data from Sorrie & Weakley (2001)
***Species richness data from PLANTS and NatureServe Explorer (accessed Aug 2009)
****Endemic species data from World Conservation Monitoring Centre of the United Nations Environment Programme (UNEP-WCMC), 2004. Species Data (unpublished, September 2004).
*****Loarie SR, Carter BE, Hayhoe K, McMahon S, Moe R, et al. (2008) Climate Change and the Future of California's Endemic Flora. PLoS ONE 3(6): e2502.
California floristic province:
So...27% endemism in the southeastern Coastal Plain is rather impressive, especially considering the limited variation in topography.
Let's take a closer look...
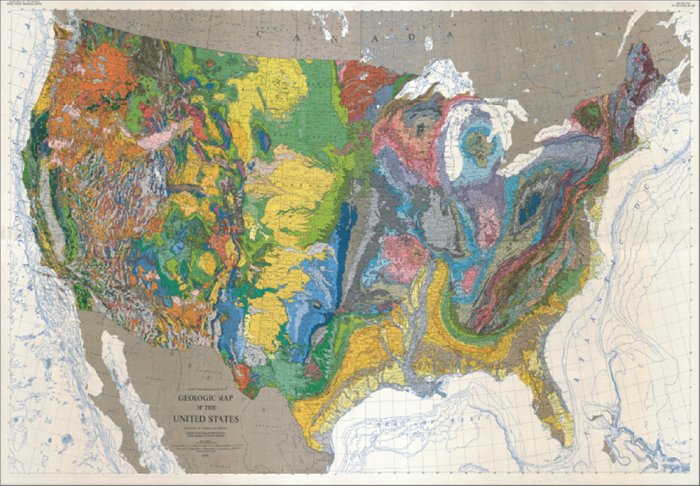
Figure from: http://rst.gsfc.nasa.gov/Sect6/USGS_2pc_geologic_us_map.jpg
The following series of figures comes from Sorrie & Weakley (2001)
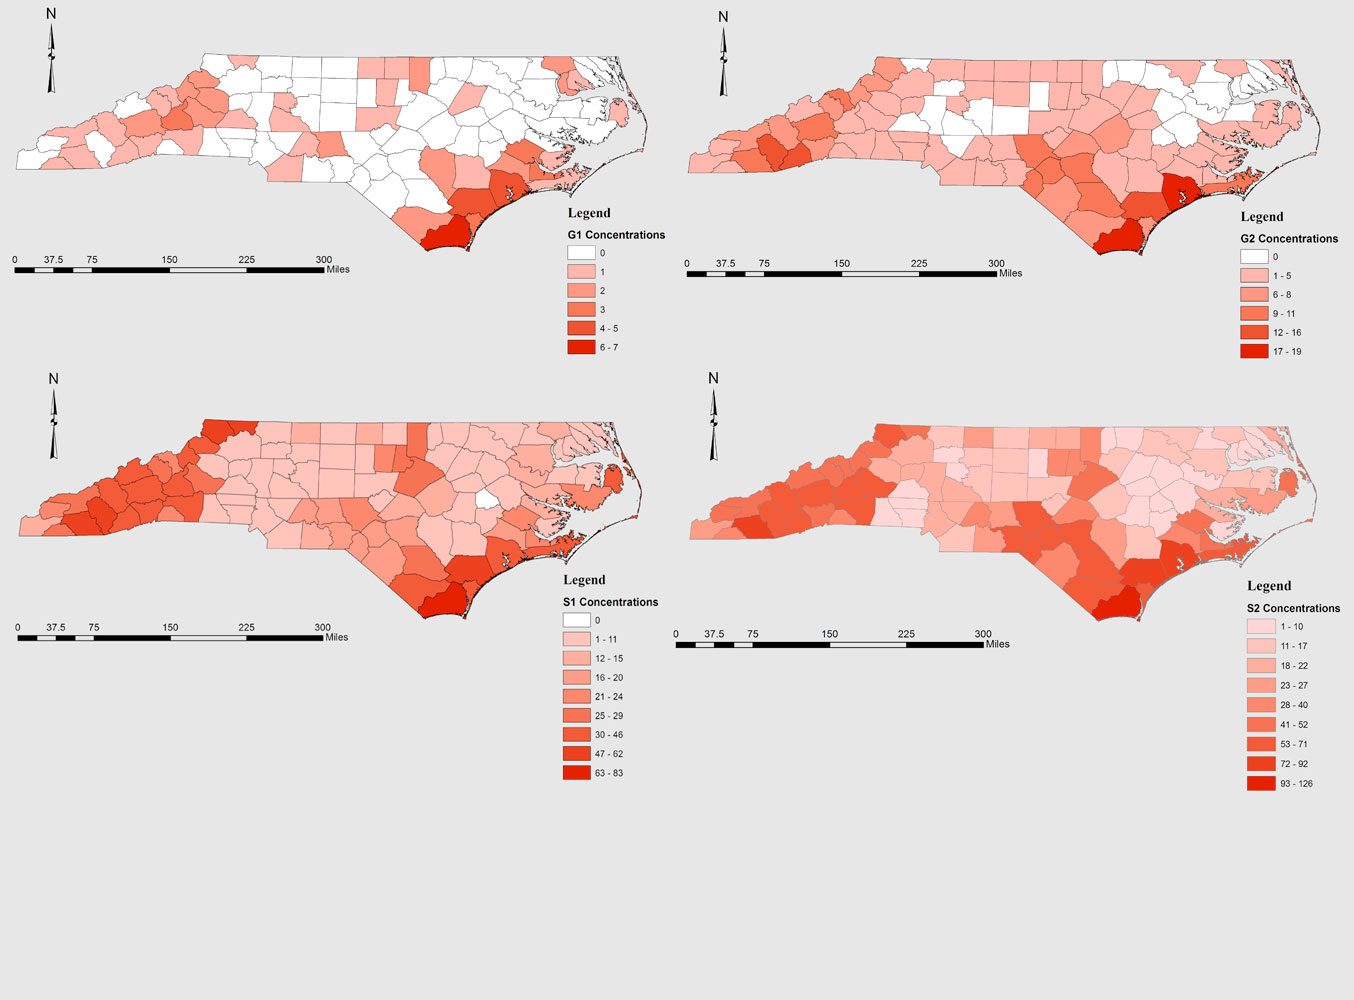
NatureServe categories: G1= Critically Imperiled; G2 = Imperiled; G3 = Vulnerable; G4 = Apparently secure


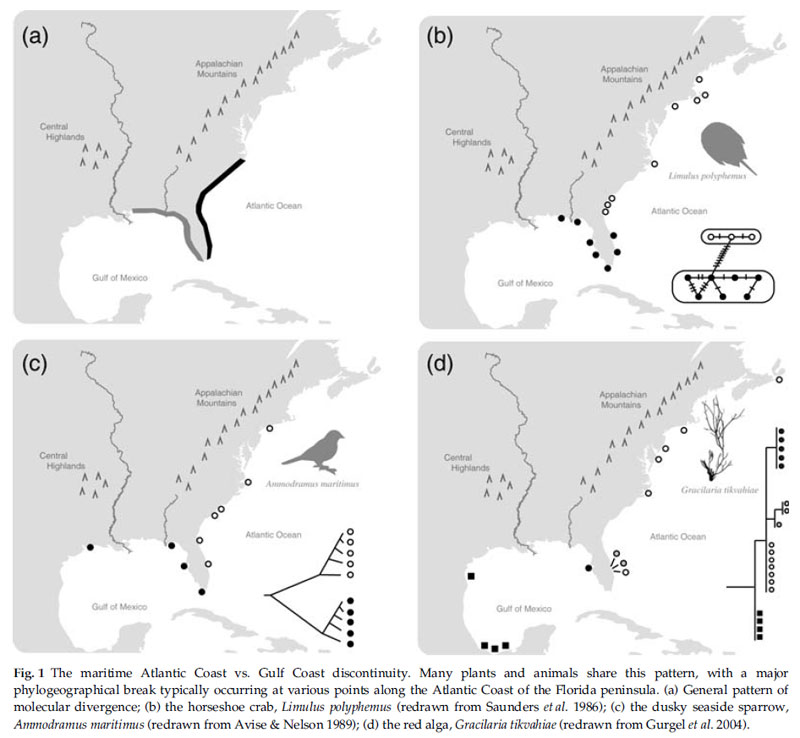
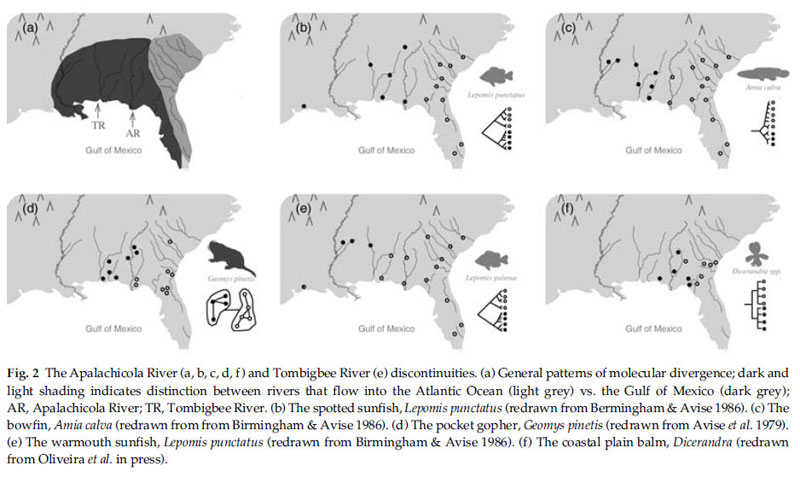
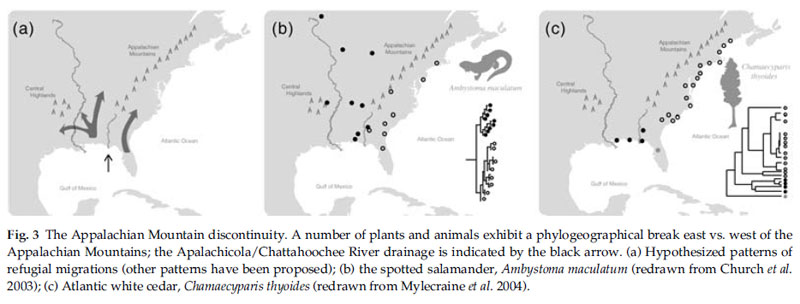
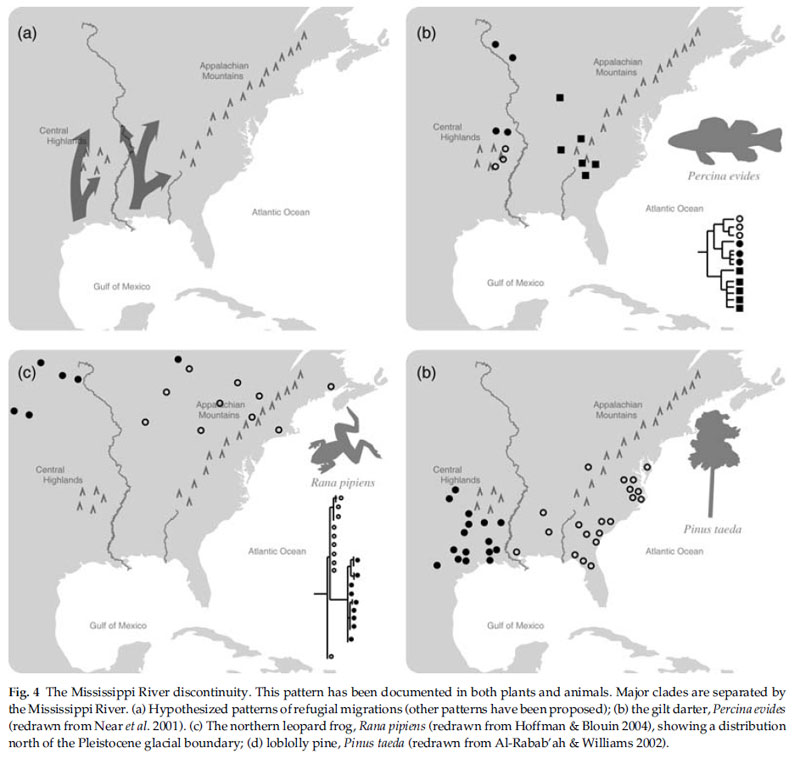
Some patterns appear to co-occur in plants in animals, as summarized by Soltis et al. (2006):
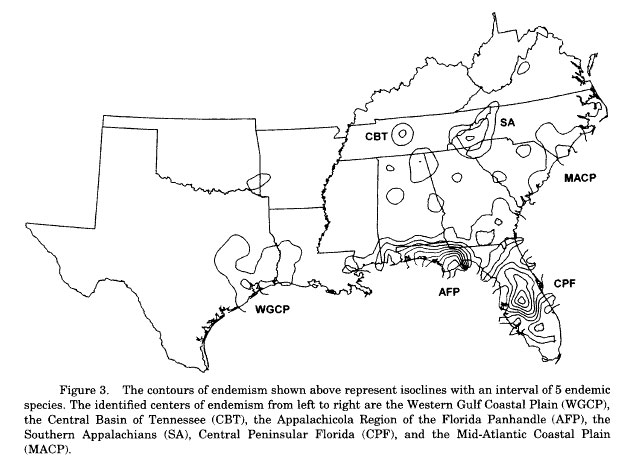
Plant species distributional data can also be organized by state to localize the highest concentrations of rare endemics (from Estill & Cruzan 2001):
What explains all these patterns?
Exact causes unknown, but likely interplay between uplift, emersion, changes in climate (incl.
hydrology) and fire regimes. Causal speciation events were likely multiple and cannot be traced to common occurrences
across all taxonomic groups. Much work on individual taxa remains before a holistic understanding can emerge...
So, what about the Carolinas?
How are species distributed in our neck of the woods?
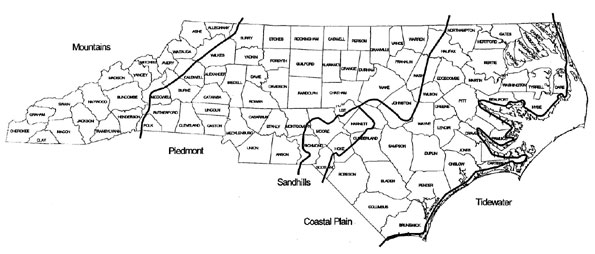
Fig. (from Franklin & Finnegan 2010). Physiographic provinces of North Carolina.
Following data is from Weakley (2005)

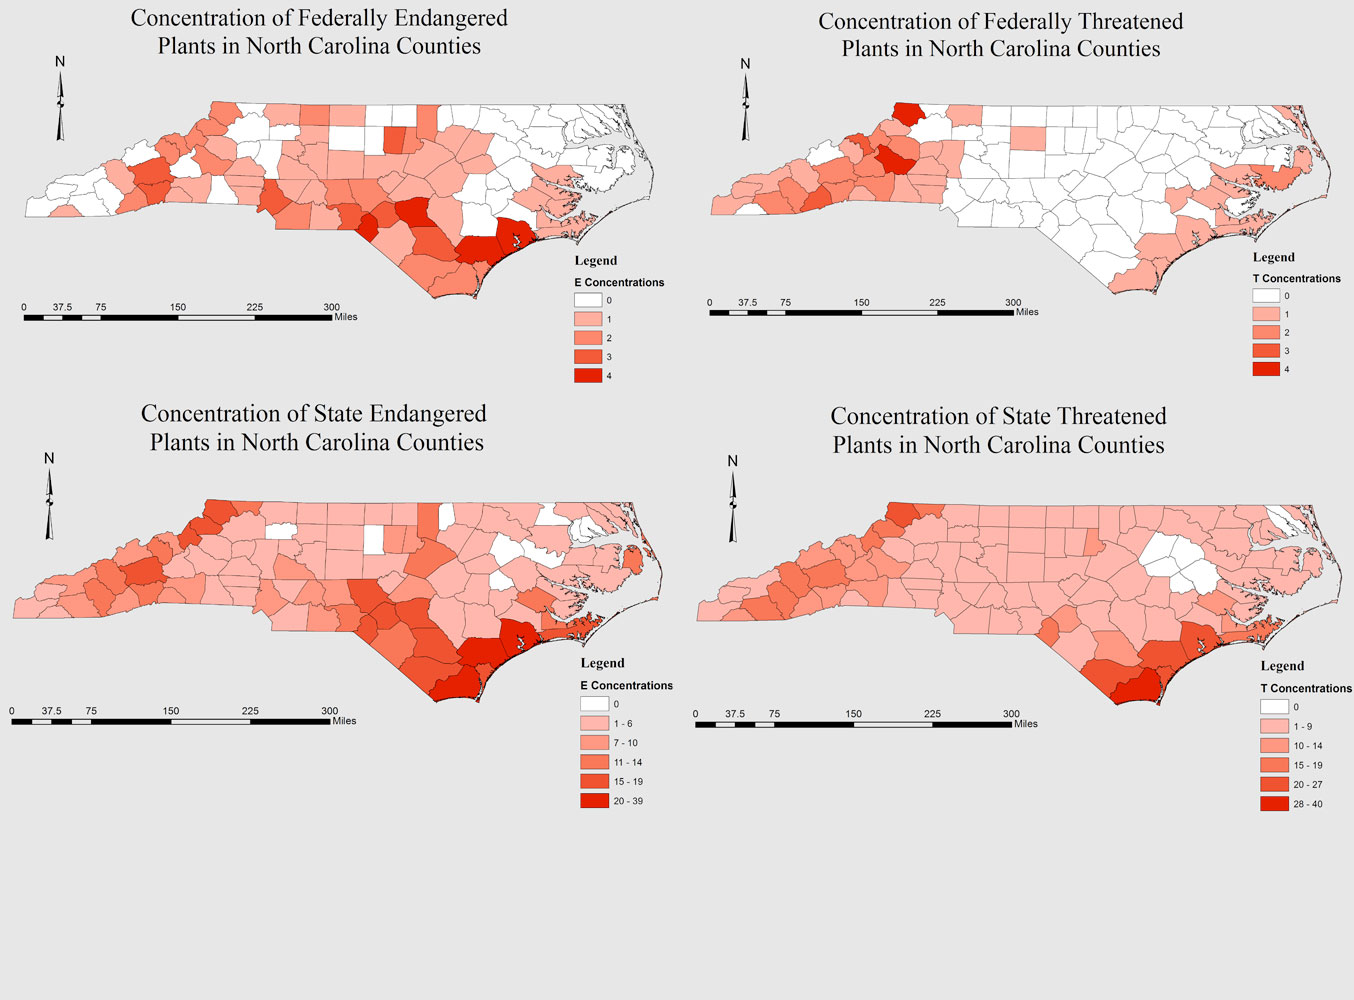
Rare species: How are rare species distributed in North Carolina?
Let's find out...
Exercise: Determining the distribution of rare species in North Carolina
Materials: (1) Plant Conservation Program (PCP) current list of listed-species, (2) Natural Heritage Program (NHP) database
Query the NHP database for thirty species chosen from the PCP list. Make sure you check the "topo" option in the NHP database. Open a Word document into which the distribution maps resulting from the NHP database search can be pasted. Once you have all the maps together, study them and note similarities and differences in patterns.
Table: Distributions of listed species by physiographic region and habitat in North Carolina. Excludes taxa generally distributed through two or more regions (i.e., General Bottomland [13 spp.], General Woodlands [4 spp.], General Wetlands [1 sp.], Pied/CP Woodland [3 spp.], Pied/CP Moist Bottom [4 spp.], Pied/M Mafic [4 spp.], Riverside Glade [5 spp.]) or historic taxa (9 spp.). See also these maps for summaries by:
or Federal/State status.Coastal Plain |
Mountains |
Piedmont |
Sandhills |
Pine (66 spp. total) Wet Pine (42 spp.) Dry Pine (24 spp.) |
Wetland (54 spp. total) Bog (36 spp.) Spray (8 spp.) Seep (7 spp.) Fen (2 spp.) Riparian (1 sp.) Other (6 spp.) |
Diabase/Mafic (22 spp.) |
Sandhill Seep (8 spp.) |
Bottomland (27 spp. total) Black (25 spp.) Roanoke (2 spp.) |
Peaks (39 spp. total) Summit (20 spp.) Balds (7 spp.) Calc. outcrops (6 spp.) Acid. outcrops ( 5 spp.) Granite dome (3 spp.) |
Piedmont Woodland (19 spp.) |
Sandhill Mesic Pine (3 spp.) |
Maritime & Barrier (25 spp.) |
Cove (30 spp. total) Rich (26 spp.) Acid (4 spp.) |
Piedmont Mesic Forest (6 spp.) |
Sandhill Sand Barren (3 spp.) |
Limesink Pond (16 spp.) |
Woodlands & Glades (23 spp. total) Mafic glade (10 spp.) General woodland (6 spp.) Serpentine barren ( 5 spp.) Granite glade (2 spp.) |
Pied Marl (1 sp.) |
|
Bays (15 spp. total) Lake (2 spp.) Clay-based (13 spp.) |
Forests (13 spp. total) Dry (7 spp.) Spruce-Fir (4 spp.) General Forest (2 spp.) |
|
|
Tidal (13 spp.) |
|
|
|
Impoundment (10 spp.) |
|
|
|
Marl (6 spp.) |
|
|
|
CP Wetlands (1 spp.) |
|
|
|
179 |
159 |
48 |
14 |
Exercise: How to make a dynamic plant species checklist for anywhere in North Carolina.
Tools: SERNEC Portal
Navigate to Dynamic Tools > Dynamic Checklist. Enter a radius. Click on the map at the point for which you desire a checklist. Click "Build Checklist". Note: This is an up-and-coming tool. Checklists are based on vouchered herbarium specimens. NSF is currently supporting databasing and imaging of herbarium specimens in the SERNEC consortium. Over the next four years, you will see much additional data here.